


Impact of Demographic Change on the Muslim Community of Tripura 
Mijanur Rahaman
Tripura is a small state of Indian Union situated in the North-Eastern part of the Indian sub-continent. The area of Tripura, in ancient time, was said to be very extensive. The present territorial area of Tripura is 10491square kilometers. Of the total area, 6, 06,150 hectares, i.e. near about 60% are forest areas. It has a geographical area of 10,491.69 sq. km. The population of our State is 36,71,2032 out of that the population belongs to minorities is 3, 35,135 i.e. 9.12% of total population of this State. The breakup of the population are Muslims 3, 28,870 (8.96%), Christian (Non ST) 2,322 (0.06%), Buddhist 3,647 (0.09%), Jain 262 (0.007%) Sikhs 34 (0.0009%) as per the census of the year 2011. Total 2, 94,837 minorities are residing in rural areas and 40,298 are in urban areas. It is difficult to find out the exact date of growth of Muslim population before beginning of the census operation in 1881. However, Muslims of Tripura are the ancient inhabitant of this state. Demographic change in Tripura affects the life of the Muslims community of this state. The number of Muslims which was 20.1% in 1960 came down to 06.6% in 1970. Thousands of Muslims were sent in the Bangladesh and at the same time due to the communal riots in Bangladesh thousands of refugees came here to take shelter and became permanent settlers. Yet in certain part of the state a very small section of educated and comparatively well to do Muslim population are living and another section of Muslims are very poor. They became marginalized community of this state and their position has come down below the other marginalized community of this state. Muslims are now backward in social, political and economic field.
Introduction
Demographics are the quantifiable statistics of a given population. Demographics are also used to identify the study of quantifiable subsets within a given population which characterize that population at a specific point in time. A word derived from the ancient Greek, “demography” literally means “describing the population”. And that’s precisely what demographers do: they describe the size, composition and structure of populations. The term “demographic change” is most commonly used to refer to shifts in population structure that have emerged in many industrialized nations including Germany since the 1970s, chiefly as a result of three major developments: declining birth rates, longer life expectancy and increasing immigration. These changes present many challenges, but many opportunities, as well.
However, the state of Tripura experienced a huge number of migration from nearby states and areas also which resulted in its big demographic change. Tribals who were the original inhabitant of this state became minority after 1960. Tripura’s tribes lost their majority share of the population as long ago as 1960, when Bengalis took their place. Tripura’s Bengalis are Hindus however, not Muslims, many of whom came to India as refugees, after Partition in 1947 and in the 1970s, during Bangladesh’s war of independence from Pakistan.
The original inhabitants of Tripura were tribals, known for their tolerance and passive obedience to the maharajas of the Manikya dynasty for centuries. Historically, the Hindu rulers of Tripura’s Manikya dynasty had always encouraged the immigration of and settlement of non-tribals, especially Bengalis to Tripura. Rajmala authenticates the fact that Ratna Manikya (1464-1468) was the first to ‘settle 4000 Bengalis in four places’ in Tripura.
While the immigration of the Brahmins and other upper castes was encouraged to enhance the status of the state and to run its administration, encouragement to lower-caste people and landless Muslim cultivators or sharecroppers from the then East Bengal was only for reclaiming fallow lands, to increase revenue. The rulers were so desperate to bring the land under tillage that they even introduced the jangal abadi system in this land abundant and thinly populated State. In the reign of Bir Bikram Kishore Manikya, the first batch of Hindu Bengali refugees received by Tripura fled East Bengal fearing communal violence after the unprecedented Raipur (Dhaka) riot of 1941. Around 15,000 people entered Tripura. Some of them were jiratia prajas of the Chakla Roshanabad estate and hence subjects of Tripura state, in one way or the other. Most of them were offered permanent rehabilitation either in the form of employment or settlement on freehold land. A huge number of refugees migrated to Tripura from Noakhali district and Chandpur subdivision of Tipperah District (Comilla) when horrific communal riots broke out as a counter-effect of ‘Direct Action Day’ declared by the Muslim League in Calcutta on 16 August 1946. About 175,000 Hindu Bengali refugees crossed the border and took shelter in Tripura from adjoining districts after 1950. It claimed that in March-June 1950, 3,866 families had been settled on 23,450 acres. However, the Tripura government stopped the process of official registration of refugees from 1 May 1958. Still migrants continued to trickle in till 1958. But another refugee exodus began from the middle of 1963 due to huge riots in Khulna, Jessore and other districts of East Pakistan. The problem was aggravated after the riots of 1964. Refugee registration, which had stopped for the first time with effect from 1 May 1958, resumed in 1964 and finally stopped on 26 March 1971. Again, during the period of the Bangladesh War, refugee migration increased exponentially: the number of refugees (14, 16,491) that came to Tripura in 1971 was a little less than the state’s total population (15,36,342).
Table-1
Population History of Tripura
| Year-AD | Total Population | % of Increase | Native Tripuri | Others+ Bengali | % of Tripuri | % of Others + Bengali |
| 1881 | 95,637 | – | 83,257 | 12,380 | 87.06 | 12.94 |
| 1891 | 1,37,442 | 43 | 1,04,114 | 33,328 | 75.75 | 24.25 |
| 1901 | 1,73,325 | 26 | 1,29,431 | 43,894 | 74.68 | 25.52 |
| 1911 | 2,29,613 | 32.48 | 1,47,950 | 81,653 | 64.34 | 35.66 |
| 1921 | 3,04,437 | 31.59 | 2,08,052 | 96,386 | 68.34 | 31.66 |
| 1931 | 3,82,450 | 25.63 | 2,68,067 | 1,14,383 | 70.09 | 29.91 |
| 1941 | 5,31,010 | 34.14 | 3,18,359 | 1,94,651 | 62.06 | 37.94 |
| 1951 | 6,39,028 | 24.56 | 3,10,946 | 3,28,082 | 48.65 | 51.35 |
| 1961 | 11,42,005 | 78.71 | 3,60,070 | 7,81,935 | 31.55 | 68.47 |
| 1971 | 15,56,342 | 36.28 | 4,50,544 | 11,05,798 | 28.95 | 71.05 |
| 1981 | 20,53,058 | 31.92 | 5,83,920 | 14,69,138 | 28.44 | 71.56 |
| 1991 | 27,57,205 | 25.54 | 8,53,920 | 19,03,860 | 30.95 | 69.05 |
| 2001 | 31,91,168 | 15.74 | 10,69,622 | 21,21,546 | 33.52 | 66.48 |
Above table shows how Bengali immigrants from outside Tripura made the majority tribal into minority.
Impact of Demographic Change on Muslim
The Muslims of Tripura proved themselves as politically conscious since many years before the merging of Tripura with Independent India . Though they belong to the peasantry background, the upper section of the community involved themselves into the politics and administration of Tripura has proved that they are political activists also. Since the princely period, they involved themselves in the decision-making functions of the state. But the demographic change altered their life style.
Like the tribal, Muslim community of Tripura suffered due to demographic change. The historical background of the Muslims in Tripura shows that they are not original inhabitants of the land but settled in the early medieval period. One of the earlier kings of Tripura brought a number of Muslim families along with other Bengali castes of Hindu communities from the Muslim Sultan of Bengal and he arranged their permanent settlement in all over Tripura. King of Tripura encouraged Muslim cultivators in large numbers during the end of 17th century. Since then from time to time, the Muslim Bengalis like the major Hindu Bengali inhabitants migrated from the plane lands adjacent to the present Tripura which was regarded as District of Tipperah or State of Hill Tipperah.
According to the census of 1891, the people of Tripura were divided into two parts, i) Bengali and ii) Loutya race (Tribal). Bengalis are divided into three branches, e.g. Hindus, Muslims and Christians. Thus people inhabiting the small hilly land of Tripura are comprised of three major groups of population: Tribal, Bengali and others. Tribal are called the indigenous people of the land. Bengalis- both Hindu and Muslims are the permanent immigrants for several centuries i.e. since the historical and medieval period. Others comprise of people came from different regions of India and also outside of India. Muslims population in Tripura during 1874-75 was in second position after the Tribals who had first position and Manipuri, Hindus, Christians 3rd, 4th and 5th position respectively.
Table-2
Different Communities of Tripura (1874-75)
| Sl.No. | Name of the community | Population |
| Tribe | 42345 | |
| Muslim | 14225 | |
| Manipuri | 7045 | |
| Hindu | 4339 | |
| Christians | 112 | |
| Not classified(others) | 173 | |
| Total | 74242 |
At present the population of the State is 36,71,032 out of that the population belongs to all minorities is 3, 35,135 i.e. 9.12% of total population of this State. The breakup of the minority population are Muslims 3, 28,870 (8.96%), Christian (Non ST) 2,322 (0.06%), Buddhist 3,647 (0.09%), Jain 262 (0.007%) Sikhs 34 (0.0009%) as per the census 2011. Total 2,94,837 minorities are residing in rural areas and 40,298 are in urban areas.
Muslims of Tripura are backward in all the aspects of their life. Demographic change in the Muslim population is one of the causes for their socio-economic position to remain at the bottom of social heap. The number of Muslims which was 20.1% in 1960 came down to 06.6% in 1970. Thousands of Muslims were sent to Bangladesh and at the same time due to the communal riots in Bangladesh thousands of refugees came here to take shelter and became permanent settlers. Yet, in certain part of the state a very small section of educated and comparatively well to do Muslim population are living and another section of Muslims is very poor.
Table-3
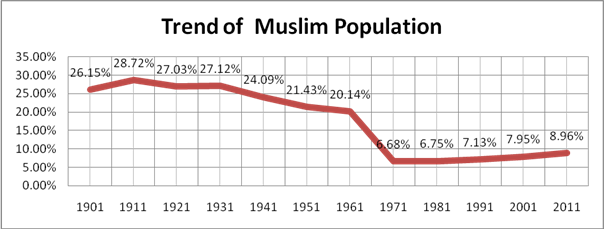
Muslim Population
| Year | Total Population | Muslim Population | % of Muslim Population |
| 1901 | 173325 | 45323 | 26.15% |
| 1911 | 229613 | 65953 | 28.72% |
| 1921 | 304437 | 82288 | 27.03% |
| 1931 | 382450 | 103720 | 27.12% |
| 1941 | 513010 | 123570 | 24.09% |
| 1951 | 639029 | 136950 | 21.43% |
| 1961 | 1142005 | 230002 | 20.14% |
| 1971 | 1556342 | 103962 | 6.68% |
| 1981 | 2053058 | 138529 | 6.75% |
| 1991 | 2757205 | 196495 | 7.13% |
| 2001 | 3199203 | 254442 | 7.95% |
| 2011 | 36,71,032 | 3, 28,870 | 8.96% |
Source: Census of India (Tripura) 1991 & Trend of Muslim population (Census Reports 1931-1971)
Figure-1
However, large-scale demographic movement continues to take place in the NE, resulting in demographic imbalance in this state. At the time of partition, in East Pakistan (now Bangladesh) the Hindu population was 25.6 percent. It got reduced to 14 percent in 1991 and today it has come down to terrible 7 percent. Most of the Bengali people of Tripura were originally inhabitant of East Pakistan. During the first half of the freedom movement of Bangladesh (1971) total refuges in Tripura from Bangladesh were 1221754 as stated in the table-4.
Table-4
Total Refuges in Tripura from Bangladesh
| Category | Population |
| Local people | 1559000 |
| Refugee | 1221754 |
| Total shibir | 36 |
| Unit | 382 |
| Peoples in shibir | 692154 |
| Personal adjustment | 150000 |
| With relative | 389600 |
| Sent outside the state | 25440 |
| Reserved | 75000 |
| Expenditure up to August | Rs. 45crores |
| Treatment | Total 360 doctors and health stuff |
Source- Roy, Bidhan, “Agartala Ekattuor” (2013) (Bengali), Parijat Prakashani, Dhaka-1100, p.17
Even when Pakistan surrendered to Indian army, there were more than 16 lakh refugees in Tripura from Bangladesh. However, large-scale demographic movement continues to take place in the NE, resulting in demographic imbalance in this state. At the time of partition, in East Pakistan (now Bangladesh) the Hindu population was 25.6 percent. It got reduced to 14 percent in 1991 and today it has come down to terrible 7 percent. Most of the Bengali people of Tripura were originally inhabitant of East Pakistan.
However, this demographic change influences the life of the people. Their number reduced and the Muslims became backward in this state. They are backward socially, economically and politically.
Educational Scenario
Owing to lack of education, the Indian Muslims lagged far behind in every walk of life. Due to lack of high qualifications, Muslims do not get jobs in many fields in comparisons with others. Muslims are found little in professional, vocational and scientific courses. Madrassa education is one which follows traditional curriculua.
Dropout rate in class I-X among the Muslims is 74.27 percent in govt. schools compared to National Average of 62.58 percent.
Figure-2
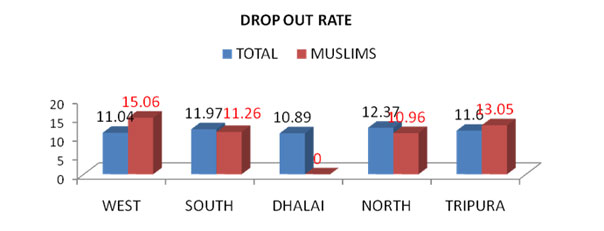
SOURCE-GOI: Annual work plan and budget on MDM 2007-08
The literacy rate among the Muslims is 49.5%. Male literacy rate is 59% and female literacy rate is 41%. Muslim literacy is lower than General literacy rate (65.5%). Their female literacy in compare to male is insignificant.
Figure-3

Source-Census 2001
In Tripura Muslims students’ participation is low in higher education. In each college, it is seen that the number of Muslim student is very low. Girls’ position in colleges is less than 1.5% where boys’ position is 3.6%.
Table-5
Muslims Student’s Enrolment in Colleges
| Total Students | Muslims Students | |||||
| Total- | Male | Female | Total- | Male | Female | % |
| 29607 | 17861 | 11746 | 1445 | 1066 | 379 | 4.8 |
Source-data collected from 22 colleges
In professional colleges, it is seen that the number of Muslim participation is very low i.e. 1.04% and girl’s position is 0.3% of the total.
Table-6
Muslims students in professional colleges
| Total students | Muslims | ||||||
| Name of colleges | Boys | Girls | Total | Boys | Girls | Total | % |
| Govt. College of Arts and Crafts | 37 | 92 | 129 | 01 | 01 | 2 | |
| Govt. Law College | 86 | 74 | 160 | 3 | 0 | 3 | |
| Womens Politechnic, Hapania | 76 | 76 | 1 | 1 | |||
| Dhalai District Politechnic | 182 | 52 | 234 | 2 | 2 | ||
| Tripura Institute of Technology 1.Degree Level Students 2.Diploma Level Students |
660 | 233 | 893 | 5 | 3 | 8 | |
| 388 | 229 | 617 | 5 | 2 | 7 | ||
| Govt. College of Art and Craft | 87 | 92 | 179 | 1 | 1 | ||
| Total | 1440 | 848 | 2288 | 17 | 7 | 24 | 1.04 |
Source-data collected from 22 colleges
Student participation in university proves their backwardness in education. The number of Muslim girl participation is lower than the boys.
Figure-4
Muslims students’ enrolment in Tripura University
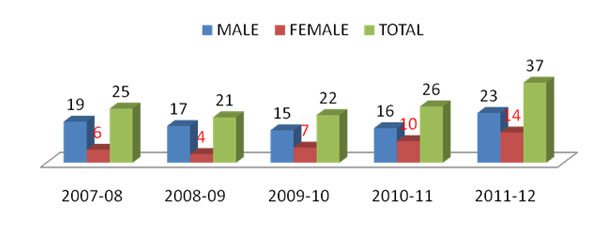
Source-SPIO, T.U. 2012
Figure-5
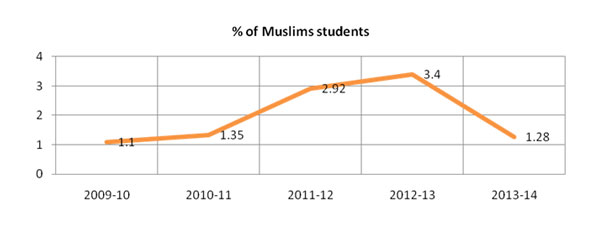
Source-SPIO, T.U. 2012
From the above discussion, it is seen that educationally Muslims are backward both at school level and also at higher level. Due to the lack of education Muslim participation in economic and political field is also negligible.
Muslim representation is lower than the total candidates and female representation is less than half of males representation.
Table-7
Muslims Representation in Professional Courses
| Qualification | Total in Tripura | Muslim | ||||
| Male | Female | Total | Male | Female | Total | |
| BE Civil | 293 | 77 | 370 | 1 | 0 | 1 |
| BE Electrica | 227 | 118 | 345 | 3 | 0 | 3 |
| BE Mechani | 253 | 45 | 298 | 2 | 0 | 2 |
| PG civil | 17 | 3 | 20 | 0 | 0 | 0 |
| PG Electrica | 9 | 3 | 12 | 0 | 0 | 0 |
| PG Mechani | 7 | 0 | 7 | 0 | 0 | 0 |
| Diplo Civil | 423 | 40 | 463 | 6 | 0 | 6 |
| Diplo Electri | 247 | 39 | 286 | 5 | 0 | 5 |
| Diplo Mech | 345 | 15 | 360 | 3 | 0 | 3 |
| ITI | 1845 | 158 | 2003 | 8 | 0 | 8 |
| MBBS | 47 | 25 | 72 | 0 | 0 | 0 |
| BDS | 42 | 19 | 61 | 0 | 0 | 0 |
| Vetenary | 23 | 11 | 34 | 0 | 0 | 0 |
| BAMS | 37 | 10 | 47 | 2 | 0 | 2 |
| BHMS | 49 | 32 | 81 | 1 | 0 | 1 |
| Agri BSc | 77 | 24 | 101 | 0 | 1 | 1 |
| Agri MSc | 31 | 15 | 46 | 0 | 0 | 0 |
| Lawyer | 124 | 30 | 154 | 0 | 0 | 0 |
| BBA | 118 | 36 | 54 | 0 | 1 | 1 |
| BCA | 139 | 44 | 183 | 1 | 0 | 1 |
| MBA | 109 | 28 | 137 | 1 | 0 | 1 |
| MCA | 41 | 21 | 62 | 1 | 0 | 1 |
| Chemical eng | 0 | 1 | 1 | 0 | 0 | 0 |
| Total | 4503 | 794 | 5197 | 34 | 2 | 36 |
Source – SPIO, Employment Exchange, 2011
It means that girls are not getting sufficient education and opportunities in the society.
Muslims female literacy is lesser than the male literacy rate. In rural area, the number is more pitiable.
Table-8
Literacy among the Muslims in rural and urban areas
| Total Muslim Population | Literate | % | Male | % | Female | % | |
| Total | 254442 | 125973 | 49.50951 | 74356 | 59.02535 | 51617 | 40.97465 |
| Rural | 236748 | 115605 | 48.8304 | 68369 | 59.14018 | 47236 | 40.85982 |
| Urban | 17694 | 10368 | 58.59613 | 5987 | 57.74498 | 4381 | 42.25502 |
source-Census 2001
Economic Scenario
Tripura being a hilly state, the cultivated area is not much compared to the other states of India. There are no huge industries where people would get employment opportunities and other economic facilities. Most of the people have to depend on govt. services. Many of them are depending on agriculture, forest like rubber plantation, small business, export, import, daily labour etc. Families belonging to Below Poverty Line in Tripura among the Muslims are more (34.44%) than the National Average of (26.10%).
Figure -6
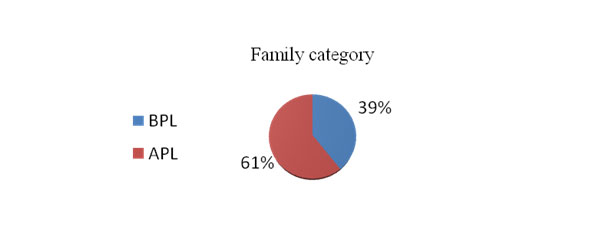
It is found in both the blocks that total number of among the Muslim community is 39% and APL listed is 61%.
The numbers of educated unemployed among the Muslims girls are very low.
Table-9
Unemployment among the Muslims
| UR | Male | Female | Total |
| 175224 | 115012 | 290236 | |
| Muslim | Male | Female | Total |
| 14846 | 5693 | 20539 |
Source-employment exchange report, 2012
Even their number is microscopic in the field of engineering, medical and other professional fields.
- Tripura state has sent 14 IAS officers to Indian administration, serving across the country, out of which none was Muslims. There are 4 TCS officer and one TPS officer of Muslim community in Tripura.
Figure-7
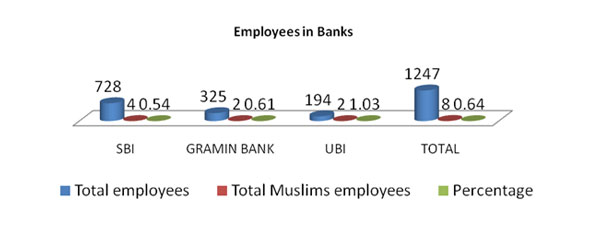
Figure-8
Figure-9

Source-Surveyed by most of the govt. departments
The figure shows the total employment situation of the Muslims of Tripura. Muslim’s share in govt. services is found only 2.69% where their population share is almost 9% in Tripura.
Business
- In Business: (Sonamura) above 76% Muslims around the market
- It is seen that out of 102 medicine sellers, only 18 belongs to Muslims. Out of 95 pharmacists, the number of Muslims is 18.
- Out of 82 stalls at Dainik bazaar, Muslims stalls are 10. In the main market, out of 108 stalls, 36 belong to Muslims. In case of small business, out of 410 stalls, Muslims have 125. Out of 36 fisheries, the number of Muslims is 5. However, Muslims have 26.28% share in business.
- Muslims’ share in other fields under those villages are shown below-
- In govt. services 2.5%
- In foreign countries 640
- Other states 285
- Driving profession-125
- Car business-128
In Kamalpur market the Muslims have low share in the business. Through the research it was seen that out of 982 stalls, Muslims have only four stalls and in Manikbhander market, out of 495 stalls, Muslims have 12 stalls. It shows their participation in business is very low. Out of 9% population, 1.5% has been staying outside the state.
- Loan sanctioned for Muslims community through banks-
UBI Tripura
Total-274989.11
Muslims-15384.35
% of Muslims- 5.95%
Gramin Bank Tripura
Total-118934
Muslims-1367
% of Muslims- 1.14%
Muslim Women’s backwardness
It is seen in the above discussion that the position of Muslim women is negligible in respect of males of this community. In the field of education, employment, politics and working participation, Muslim women reside at the level of ground. As per census data literacy rate is not so bad among female population of Tripura in comparison with Indian standard. But lower in comparison within Tripura. Girls’ position in colleges is less than 1.5% where boys’ position is 3.6%. In professional colleges, the number of Muslims participation is very low or 1.04% and girl’s position is 0.3% of the total.
Muslims of Tripura are generally spread throughout the state. There are variations in terms of language, cultural activities, and ethnic differentiations. So due to these diversities, they have never been able to integrate themselves as a united community.
Recently, 124 villages and 27 wards of Nagar Panchayet have been re-identified where 20% and more minority population reside for multi-purpose development.
Election Commission of Tripura reported that presently (2013) there are no candidates in Lok Sabha and Rajya Sabha from Muslim community and only 2 male candidates are in the Vidhan Sabha from the minority Muslims. Since the formation of this state, no women candidate from the Muslim community elected as MP or MLA.
The Muslim participation in assembly election from 1952 to 2013 is 43 from Congress, 31 from CPI (M) and 74 from others or neutral party.
- Total contesting candidates from Muslims (assembly election)
Table -10
| Year | Congress | CPIM | Others |
| 1952 | 5 | 3 | 10 |
| 1957 | 6 | 2 | 9 |
| 1962 | 4 | 4 | 5 |
| 1967 | 3 | 1 | 1 |
| 1972 | 3 | 2 | 4 |
| 1977 | 3 | 3 | 8 |
| 1981 | 1 | ||
| 1983 | 3 | 2 | 3 |
| 1988 | 2 | 2 | 2 |
| 1993 | 2 | 2 | 8 |
| 1998 | 3 | 2 | 3 |
| 2003 | 2 | 3 | 8 |
| 2008 | 3 | 2 | 13 |
| 2013 | 3 | 3 | |
| total | 43 | 31 | 74 |
Source- Magazine of Tripura Darphan, 2013
The Muslim participation in different blocks are not equal to their population. In some blocks, it is seen that Muslims participation is nil.
Table-11
Panchayet (Election, 2009, Contesting Candidate)
| Gram Panchayet Election, 2009 | ||||||
| 23 Nos. Block | No. of GP | NO. of Contesting Candidate | NO. of Muslims | % of Muslims | Male | Female |
| Total | 511 | 10899 | 1276 | 11.7 | 712 | 398 |
Source-Election Commission, Directorate of Panchayet, Govt. of Tripura
Women are getting more participation opportunity to contest as 1/3rd has been reserved for them.
Table -12
Panchayet (Contesting Candidates, 2009 under three tiers)
| Total Contesting Candidates, 2009 | |||||
| Sl No | Name of Bodies | Total GP/PS/ZP | Total Seats | Total Contesting Candidates | Total Women Candidates |
| 1 | Gram Panchayet | 511 | 5295 | 10983 | 4060 |
| 2 | Panchayet Amity | 299 | 299 | 683 | 269 |
| 3 | Zilla Parishad | 82 | 82 | 208 | 54 |
| Total | 892 | 5676 | 11874 | 4383 | |
Source-Election Commission, Directorate of Panchayet, Govt. of Tripura
Total Muslims contesting candidate in three tiers Panchayet is very low.
Table -13
Panchayet (Minority Muslims-contesting candidates, 2009)
| Minority Muslims-contesting candidates from all party, 2009 | ||||
| Sl. No | Name of the Bodies | Total Muslims contesting candidate | Male | Female |
| 1 | Zilla Parishad | 20 | 11 | 9 |
| 2 | Panchayet Samity | 65 | 43 | 22 |
| 3 | Gram Panchayet | 1276 | 712 | 398 |
| Total | 1361 | 766 | 429 | |
Source-Election Commission, Directorate of Panchayet, Govt. of Tripura
Muslims holding the office of Pradhan in Three-tier Panchayet in Tripura is lower than the other communities.
Figure-11
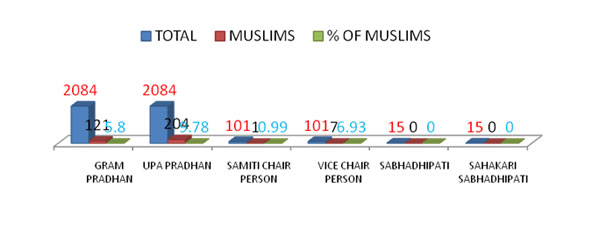
It is clear that Muslims women participation in the decision making bodies is lower than Muslims male.
Table-14
Muslim Pradhan and UpaPradhan Panchayet Election, 2009
| Pradhan | Upa Pradhan | ||||
| Total | Male | Female | Total | Male | Female |
| 41 | 28 | 13 | 85 | 88 | 07 |
Source-Election commission, Directorate of Panchayet, govt. of Tripura
`
Less number of participation of Muslims in Panchayet and women’s poor condition gallantly exemplify that Muslims are victimized politically.
Table no. 15
Muslims Members in Three-tier Panchayet (1994, 1998, 2004)
Source-Election Commission, Directorate of Panchayet, Govt. of Tripura
Muslim Representatives for Gram Panchayet under few Blocks shows that Muslims women representation is very low.
Table no-16
Muslim Representatives for Gram Panchayet under few Blocks
| Sl.No.. | Name of the Block | Women Elected | Muslim Women & % of total women |
| 1 | Dukli | 17 | 04 (23.52) |
| 2 | Jirania | 93 | 07 (7.53) |
| 3 | Bishalgarh | 32 | 14 (43.75) |
| 4 | Kathalia | 21 | 13 (61.90) |
| 5 | Boxonagar | 23 | 19 (82.61) |
| 6 | Melaghar | 23 | 17 (73.91) |
| Total in West district | 160 | 123 (76.87) | |
| 1 | Gournagar | 55 | 28 (50.91) |
| 2 | Salema | 11 | 04 (36.36) |
| 3 | Panisagar | 15 | 05 (33.33) |
| 4 | Kadamtala | 61 | 26 (42.62) |
| Total in North district | 142 | 63 (43.37) | |
| 1 | Matabari | 14 | 07 (50.00) |
| 2 | Kakraban | 08 | 02 (25.00) |
| 3 | Rajnagar | 03 | 01 (33.33) |
| Total in South district | 25 | 10 (40.00) | |
Source-Election Commission, Directorate of Panchayet, Govt. of Tripura
In State Legislative Assembly (Tripura) (1952—2003), it was seen that women position was very poor.
Table -17
Representation of Women in the State Legislative Assembly (Tripura) (1952—2003)
| Year | Legislative Assembly | Number of Seats | Number of elected women | Percentage to the total |
| 1952 | Electoral College | 30 | 1 | 3.3 |
| 1952 | Tripura Regional Council | 30 | – | – |
| 1962 | Tripura Regional Council | 30 | 1 | 3.3 |
| 1967 | State Legislature | 30 | – | – |
| 1972 | State Legislature | 60 | 2 | 3.3 |
| 1977 | State Legislature | 60 | 1 | 1.6 |
| 1983 | State Legislature | 60 | 3 | 5.00 |
| 1988 | State Legislature | 60 | 2 | 3.2 |
| 1993 | State Legislature | 60 | 3 | 5.00 |
| 1998 | State Legislature | 60 | 2 | 3.2 |
| 2003 | State Legislature | 60 | 1 | 1.6 |
Source: State Election Department, Agartala
A survey on Muslim politicians like MLA, MP, Panchayet and Nagar Panchayet members show their level of education.
Figure-12

Political participation needs good education to understand the policy and its necessity. Education makes people conscious about their rights and duties. The policy makers and the leaders who take part in the decision making should be qualified. But among the Muslims leaders in Tripura, it is seen that only a few of them are high qualified. It deprives Muslims from gaining opportunities favorable to them both at national and local level.
Conclusion
The above discussion give a clear picture of the Muslims community of Tripura. Demographic change affected the progress of Muslims in Tripura. Muslims of Tripura are backward and their backwardness is found in social, political, cultural and economic fields. Only govt. initiatives cannot make remedial measures for their condition. If the whole community cannot change their own condition with the govt. steps, their condition will remain unchanged. Muslim bureaucrats and high officials should come forward to support and give assistance to the backward Muslims. State Govt. and Central Govt. should implement those policies and programmes as suggested by Sachar Committee, Ranganath Misra Committee and Gopal Singh Committee.
Bibliography
Austin, Granville.: The Indian Constitution: Corner Stone of a Nation, Oxford University Press, New Delhi, 2004(reprint).
Bhattacharjee, A. K.: Census of India, 1971 (Tripura) Director of Census Operation Series 20, Part IIC (I), Agartala, 1976
Baig, Tara Ali : Indian Women Power, S.Chand, Delhi , 1976.
Bhattacharjee, Sabyasachi and : Situating India History, Oxford
Thaper, Romila. Delhi, 1996.
Yadav C.P.: Empowerment of women.,Anmol Publications PVT Limited, New Delhi.
Sing J.P.: The Indian Women., Gyan Publishing House, New Delhi.
Dr. (Mrs.) V, Mohini Giri: Emancipation and Empowerment of Women., Gyan Publishing House.
Joyce Tathol & Thomas N. W.: Women of All Nations., Gyan Publishing House., New Delhi.
Verma Sashi Kanta :Women in Agriculture., oncept Publishing company, New Delhi.
Kumar Raj: Women And Development., Anmol Publications PVT Limited, New Delhi.
Shirwadekar, Swati : Women and Socio-Cultural Changes., Gyan Publishing House, New Delhi.
Aleaz, Bonita: Emergent Women., A Mittal Publications, New Delhi
R. Sheth Parul: Self care for women, National Book Trust, India.
Siddiqi, M. Mazheruddin: “Women in Islam” Adam Publishers and Distributors, New Delhi-110002.
Naiks Dr, Jakir : “Calling Islam” Zakariya Publishers, 1036/B, Gali Madrasa Hussain Bux, Matia Mahal, Delhi-110006.
Chawdhry Asghar Ali,: “Ideal Women before Marriage and After Marriage” Adam Publishers and Distributors, New Delhi-110002.
Ahamed Dr. Israr, :“Religious Obligations of Muslim Women” Adam Publishers and Distributors, New Delhi-110002.
Naiks Dr, Jakir: “Rights of Women in Islam” Adam Publishers and Distributors, New Delhi-110002.
Khan Badre Alam : “Economic Rights of Women under Islamic Law and Hindu Law”. Adam Publishers and Distributors, New Delhi-110002.
Iqbal Safia: “Women and Islamic Law”. Adam Publishers and Distributors, New Delhi-110002.
T.S. Sodhi: A Comparative Study of the Personality Patterns of Students of Religious and Secular Institutions, PhD Thesis, Agra University, 1970.
D.G. Rao: A Study of Some Factors as Predictors of Academic Achievement: A Review of Research, Edu.Psychol.Review, 1967
Manas Paul, The Eyewitness: Tales from Tripura’s Ethnic Conflict, Lancer Publishers,
New Delhi, 2009, p. 25 as cited in Changing Mentality of the Bengalee Refugees: The Story of Tripura (1946-1971) By Anindita Ghoshal Assistant Prof. in History, Rishi Bankim Chandra College, Naihati Refugee Watch, 39 & 40, June and December 2012
As declared by the Tripura Durbar, a tenant who accepted a lease for reclamation of hilly lands by clearing jungles got remission of rent at least for three years from the date of lease is called jangal-abadi system.
Changing Mentality of the Bengalee Refugees: The Story of Tripura (1946-1971) By Anindita Ghoshal Assistant Prof. in History, Rishi Bankim Chandra College, Naihati Refugee Watch, 39 & 40, June and December 2012
Landless labourers who used to work in khas lands owned by the royal family of
Tripura in the zamindari of Chakla Roshanabad for decades. Though they were
share croppers, the maharajas of Tripura often treated them as their own subjects,
whom they could not evict.
Interview with Jiten Pal in Agartala on 24 February 2012 as cited in Changing Mentality of the Bengalee Refugees: The Story of Tripura (1946-1971) By Anindita Ghoshal Assistant Prof. in History, Rishi Bankim Chandra College, Naihati Refugee Watch, 39 & 40, June and December 2012
B.G. Verghese, India’s North East Resurgent: Ethnicity, Insurgency, Governance, Development, Konark Publishers Pvt. Ltd., New Delhi, 1996, pp. 167-169
File No. F. 3(1)/57 ADM, Year-1957, Rehabilitation Department, Tripura State Archives as cited in Changing Mentality of the Bengalee Refugees: The Story of Tripura (1946-1971) By Anindita Ghoshal Assistant Prof. in History, Rishi Bankim Chandra College, Naihati Refugee Watch, 39 & 40, June and December 2012
Jagadis Gan-Chaudhuri, A Political History of Tripura, Inter-India Publications, New
Delhi, 1985, p. 54
Sibopada De, Illegal Migrations and the North East: A Study of Migrants from Bangladesh,
Anamika Publishers, New Delhi, 2005, p. 107
Colved Prakash, ‘Encyclopedia of North East India’, Atlantic Publishers and Distributors, vol.V., p.2186
Suchintya Bhattacharya, Genesis of Tribal Extremism in Tripura, New Delhi: Gyan Publishing House, 1991, p. 54.
Source-Status of Women in Tripura by-Mr. Ratan Chakraborty and Ms. Minakshi Sen Bandyopadhyay www.google.com-30-11-2013
Mijanur Rahaman, Rahaman is Research Scholar, Department of Political Science, Tripura University, Tripura. Email: rahaman.mizan284@gmail.com